TABLE OF CONTENT
Hammer Candlestick Pattern Explained: How to Spot and Trade Bullish Reversals
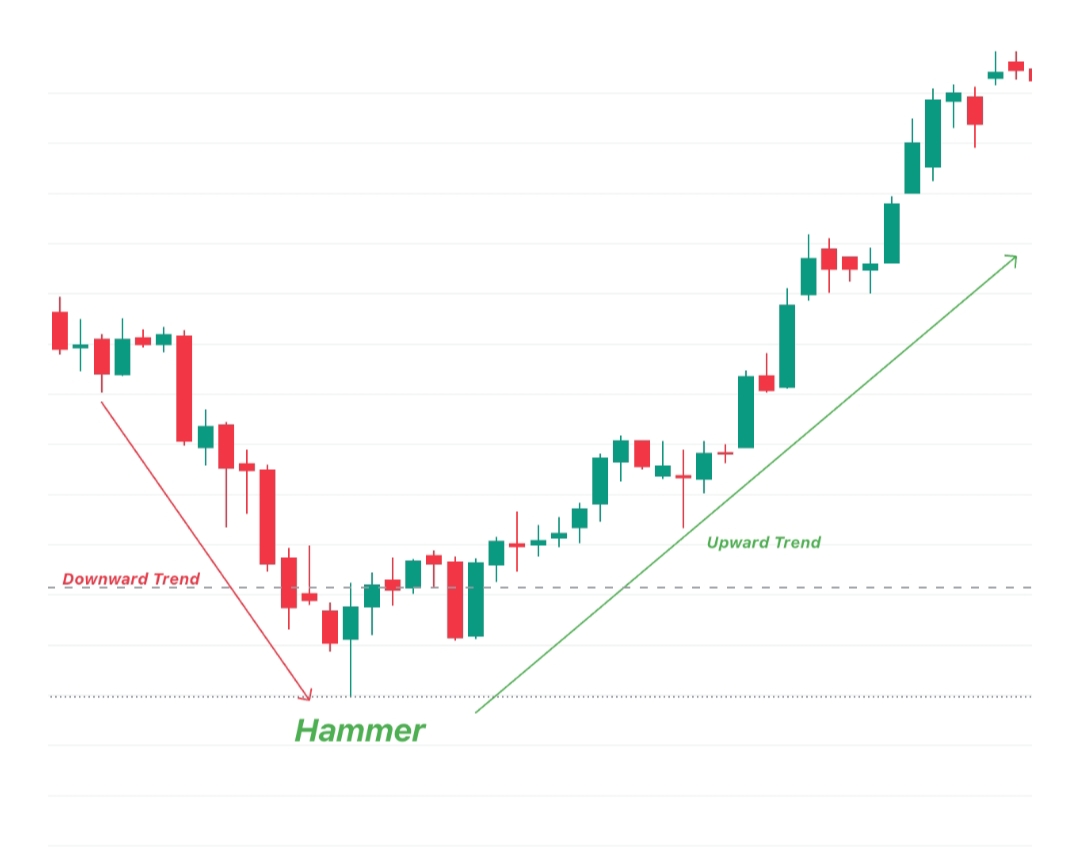
1). The Hammer candlestick pattern is a bullish reversal pattern that typically forms at the bottom of a downtrend.
2). It signifies a potential turnaround in price, suggesting that the downward momentum might be ending and an upward movement could be starting.
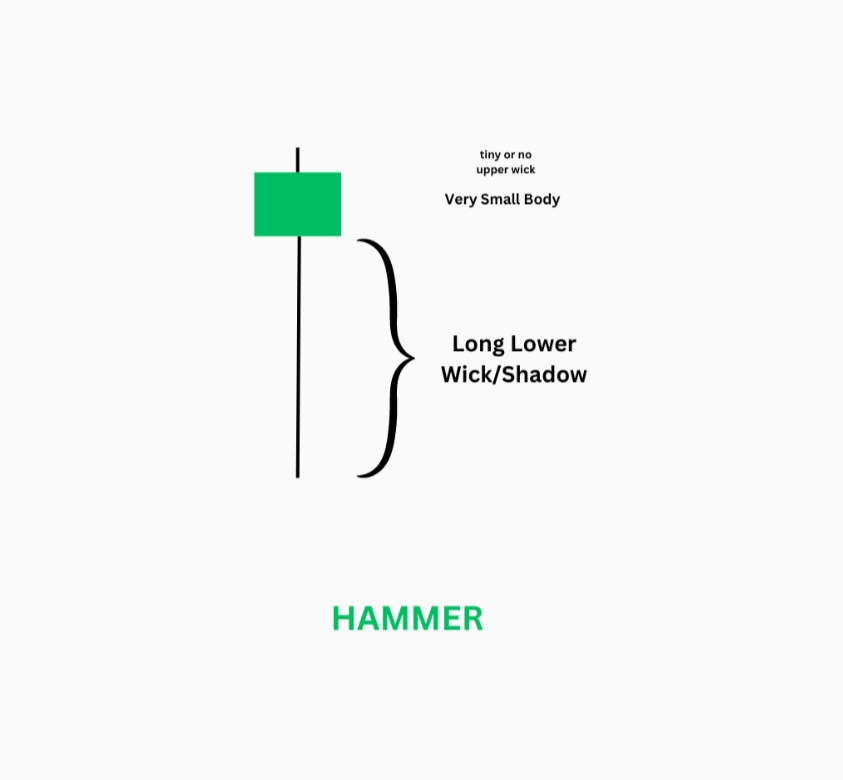
3). The pattern is named “Hammer” due to its shape, which resembles a hammer with a long handle (shadow) and a small head (body).

Single Candle Formation Hammer Candlestick
The Hammer is a single candlestick pattern that typically appears at the bottom of a downtrend.
It signals a potential bullish reversal, indicating that selling pressure may be diminishing.
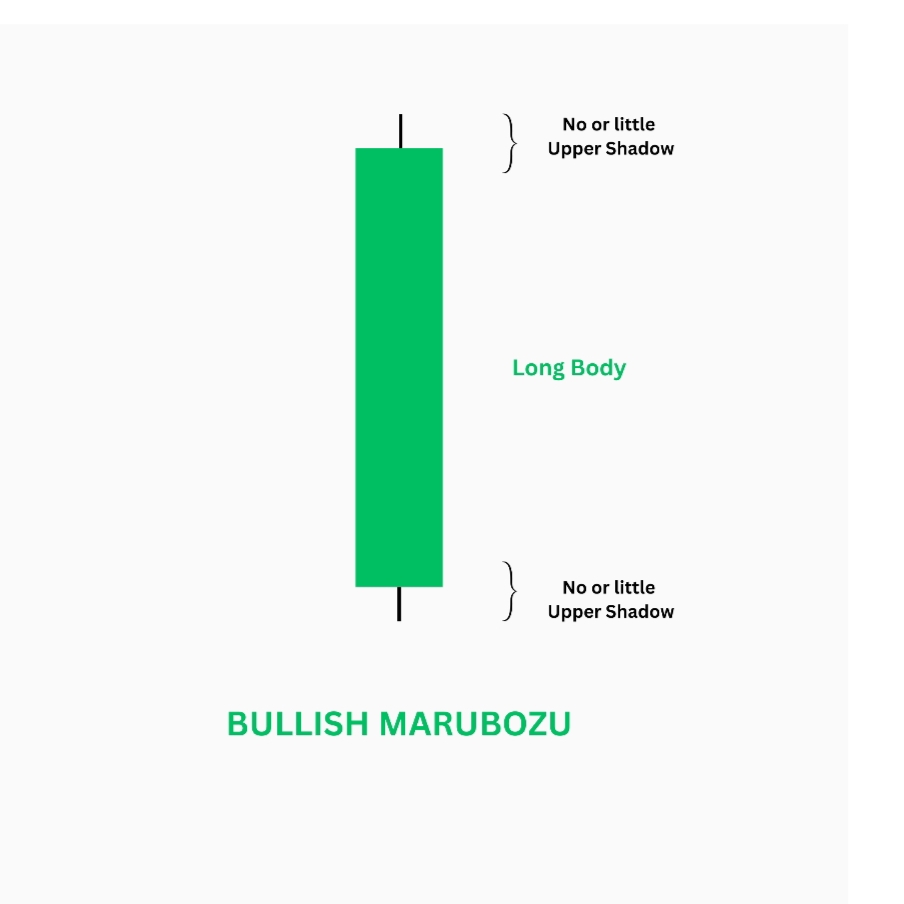
Small Real Body
The Hammer has a small real body, which can be either green (bullish) or red (bearish).
The small body is located near the top of the trading range, suggesting that the opening and closing prices are close to each other.
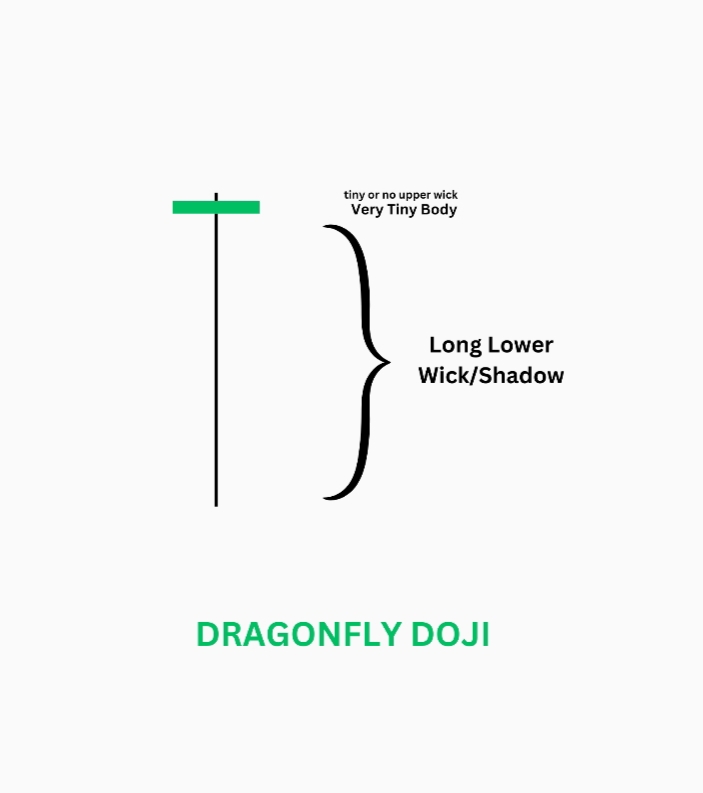
Long Lower Shadow
A defining characteristic of the Hammer is its long lower shadow, which is at least twice the length of the real body.
This long shadow indicates that the price dropped significantly during the trading session but then recovered, showing strong buying pressure.
Little or No Upper Shadow
The Hammer typically has little to no upper shadow, emphasizing that the highest price of the day was close to the opening or closing price.
The absence of an upper shadow suggests that buyers were able to push the price back up to the open or close after a significant drop.
Position
The Hammer pattern appears at the bottom of a downtrend, signalling that the market may be finding support.
Its presence suggests that the downtrend is losing momentum and a reversal to the upside may be possible.
Color of the Real Body
While the colour of the Hammer’s real body can be either red or green, a green body is often seen as more bullish.
A green Hammer indicates that the price closed higher than it opened, suggesting stronger buying interest.
Volume Considerations
Higher trading volume during the formation of the Hammer can increase the reliability of the pattern.
It suggests that a larger number of market participants are buying, reinforcing the potential for a bullish reversal.
Reversal Signal
The Hammer is considered a bullish reversal pattern.
It suggests that the selling pressure has been absorbed by buyers, who are now pushing the price higher. This can lead to a reversal of the downtrend.
Confirmation
Confirmation of the Hammer pattern is typically required through subsequent bullish price action.
A higher open or a bullish candle following the Hammer adds credibility to the reversal signal and confirms the shift in sentiment.

Psychology of the Hammer Candlestick pattern
Before the Pattern Formation:
Continuous Selling Pressure: The market is in a downtrend with sellers consistently driving the price lower. The sentiment is bearish, and most traders expect the price to keep falling.
Buyer Hesitation: Buyers are cautious and not stepping in significantly due to fear of further declines. The overall market mood is pessimistic.
During the Pattern Formation:
Initial Price Drop: The trading day starts with continued selling, driving the price even lower.
Emergence of Buyers: Throughout the day, buyers begin to see the lower prices as attractive entry points, this can be because of a near support zone or trendline, etc. Strong buying pressure starts to counteract the selling pressure.
Price Recovery:
The price rises significantly from its intraday low, closing near or above the opening price. This action creates a distinctive Hammer shape, with a long lower shadow and small body.
After the Pattern Formation:
Shift in Sentiment: The Hammer signals a potential shift in market sentiment from bearish to bullish. Traders recognise the buying pressure as a sign that the downtrend might be losing momentum.
Increased Buying Interest: More buyers are likely to enter the market, anticipating a price reversal. This can lead to further upward price movement in subsequent trading sessions.
Possible Trend Reversal: If the following trading day confirms the pattern with a higher close, it strengthens the case for a bullish reversal. The asset may start an uptrend, marking the end of the previous downtrend.


How can we trade a Hammer Candlestick pattern?
Aggressive Entry Point:
Entry: Enter a long position immediately after the Hammer candlestick closes, expecting a reversal.
Stop-Loss: Place a stop-loss order just below the low of the Hammer to manage risk. This protects against potential further downward movement if the reversal fails.
Target: Set an initial target based on the nearest resistance level or previous high. Use a risk-reward ratio based on your risk appetite (rewards should be higher than more confident trades) to ensure the potential reward justifies the risk.
Conservative Entry Point:
Entry: Wait for the next candlestick to close higher than the Hammer’s closing price, confirming the bullish reversal. Enter a long position at this point.
Stop-Loss: Place a stop-loss order just below the low of the Hammer to manage risk.
Target: Set an initial target based on the nearest resistance level or previous high. This trade can have higher risk compared to aggressive, as the next candlestick has confirmed the bullish reversal. Adjust the target as the price moves in your favour.
lock in profits
Entry: Enter a long position immediately after the Hammer candlestick closes, expecting a reversal.
Stop-Loss: Place a stop-loss order just below the low of the Hammer to manage risk. This protects against potential further downward movement if the reversal fails.
Target: Set an initial target based on the nearest resistance level or previous high. Use a risk-reward ratio based on your risk appetite (rewards should be higher than more confident trades) to ensure the potential reward justifies the risk.
Conservative Entry Point:
Entry: Wait for the next candlestick to close higher than the Hammer’s closing price, confirming the bullish reversal. Enter a long position at this point.
Stop–Loss: Place a stop-loss order just below the low of the Hammer to manage risk.
Target: Set an initial target based on the nearest resistance level or previous high. This trade can have a higher risk compared to aggressive, as the next candlestick has confirmed the bullish reversal. Adjust the target as the price moves in your favour, using trailing stops to lock in profits.
The candlestick patterns detected in this article are for educational purposes only. They do not guarantee future price movements or trading success. Always conduct your research and analysis before making any trading decisions. Trading involves risk, and past performance is not indicative of future results. The content and tools provided in this article, including strategies, are based on our experience and interpretation of market trends. These are intended for educational purposes only and should not be considered as financial advice or recommendations for trading. Trading and investing involve substantial risk, and past performance does not guarantee future results. We strongly advise consulting with a certified financial advisor or professional before making any trading decisions.