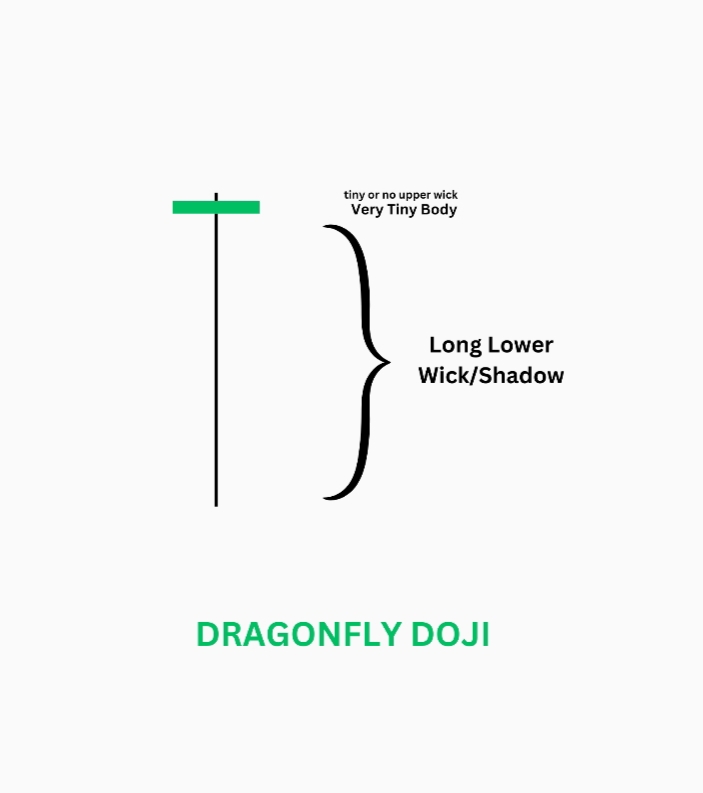
Formation Of Dragonfly Dogi Pattern
1). The Dragonfly Doji pattern is a bullish reversal pattern.
2). It forms when the open, high, and close prices are equal or very close, creating a “T” shape with a long lower shadow.
3). This pattern suggests that the selling pressure is being absorbed by buyers, indicating a potential reversal in the market.
TABLE OF CONTENT
Characteristics Of Dragonfly Doji Pattern
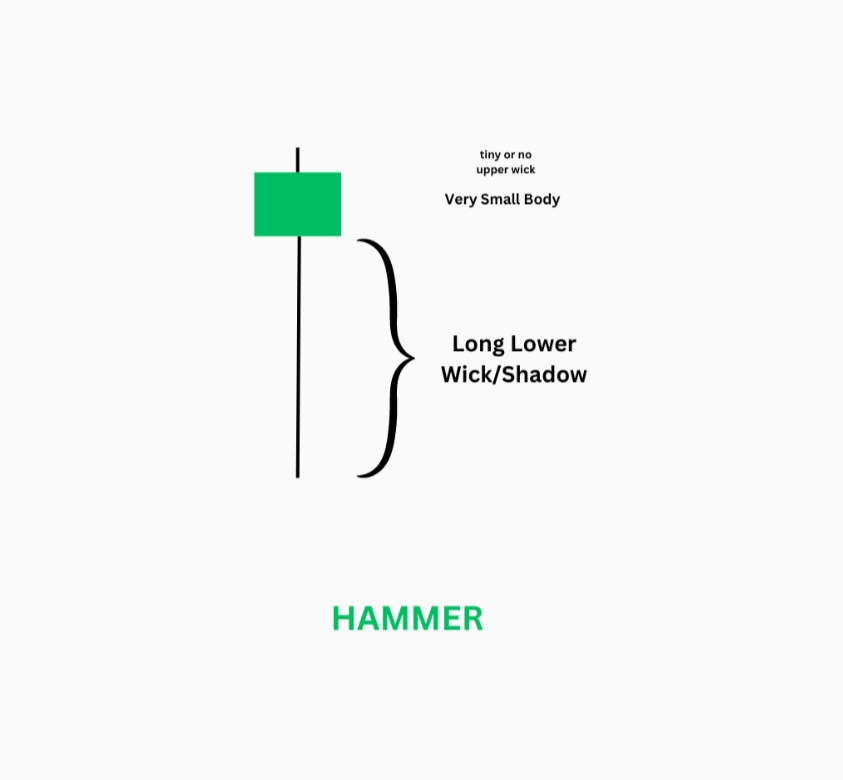
Single Candle Formation
The Dragonfly Doji is a single candlestick pattern that signals indecision or a potential reversal in the market.
It is characterized by a long lower shadow, a small or nonexistent real body, and little to no upper shadow.
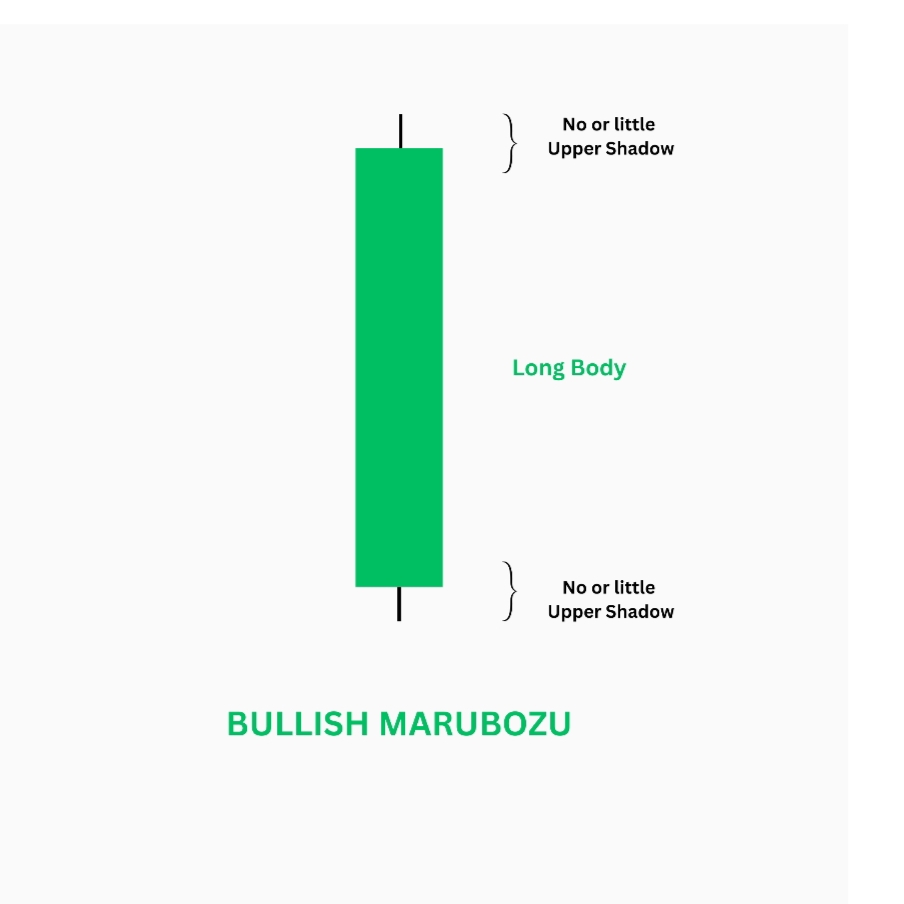
Small Real Body at the Top
The Dragonfly Doji has a small real body, often at or near the top of the trading range.
This small body indicates that the opening and closing prices are very close to each other, showing that neither buyers nor sellers have gained significant control.
Long Lower Shadow
A defining feature of the Dragonfly Doji is its long lower shadow, which is at least twice the length of the real body.
This long shadow indicates that prices fell significantly during the trading session but recovered to close near the open, showing strong buying pressure at lower levels.
Little or No Upper Shadow
The Dragonfly Doji typically has little to no upper shadow, emphasising that the highest price of the day was close to the opening or closing price.
The lack of an upper shadow suggests that buyers were able to push the price back up after a significant drop, with no further upward movement.
Position
The Dragonfly Doji can appear at the bottom of a downtrend or within a period of consolidation.
Its appearance at the bottom of a downtrend is considered a potential bullish reversal signal, indicating that the downtrend may be losing momentum.
Reversal Signal
The Dragonfly Doji is considered a potential bullish reversal pattern, especially when it appears at the bottom of a downtrend.
It suggests that selling pressure has been absorbed and that buyers are stepping in, potentially leading to a reversal.
Color of the Real Body
The colour of the Dragonfly Doji’s real body is generally irrelevant due to its small size.
The focus is on the long lower shadow and the price action within the session, not the colour of the candle.
Volume Considerations
The higher trading volume during the formation of the Dragonfly Doji can increase the reliability of the pattern.
It suggests that a larger number of market participants are active, reinforcing the significance of the price recovery.
Confirmation
Confirmation of the Dragonfly Doji pattern is typically seen through subsequent bullish price action.
A higher close or a bullish candle following the Dragonfly Doji adds credibility to the reversal signal and confirms the shift in sentiment.


Psychology of Dragonfly Dogi Pattern
Before the Pattern Formation:
Bearish Sentiment: The market may be in a downtrend or experiencing selling pressure, with prices gradually declining. Traders are predominantly bearish, expecting further declines. The sentiment is pessimistic, and buying interest is weak.
Uncertainty and Fear: As prices continue to fall, fear grows among market participants. The ongoing downtrend creates a sense of urgency to sell, and there is little confidence in a potential reversal.
During the Pattern Formation:
Initial Sell-Off: The Dragonfly Doji forms when, during the trading session, prices drop significantly, reflecting continued selling pressure. This drop aligns with the bearish sentiment and suggests that sellers are still in control.
Strong Buying Pressure: Despite the initial sell-off, buyers step in at lower levels and push the price back up to the opening level. The strong recovery indicates that buyers are finding value at these lower prices, absorbing the selling pressure and signalling a potential shift in sentiment.
Indecision: The Dragonfly Doji’s small real body, combined with its long lower shadow, shows that while buyers managed to push the price back up, neither buyers nor sellers could dominate by the session’s close. This creates a sense of indecision, with market participants unsure of the next direction.
After the Pattern Formation:
Potential Shift in Sentiment: The completion of the Dragonfly Doji pattern signals a potential shift from bearish to bullish sentiment. The strong recovery from the low creates confidence among buyers that the downtrend may be losing strength, encouraging more buying interest.
Increased Buying Interest: Following the Dragonfly Doji pattern, buying interest is likely to increase. Traders who recognise the pattern may enter the market, expecting a reversal. This increased demand can drive prices higher, confirming the reversal signal.
Psychological Impact on Sellers: The appearance of the Dragonfly Doji can create uncertainty and hesitation among bearish traders. The strong recovery from the low suggests that selling pressure is weakening, prompting some sellers to cover their positions or wait for higher prices.
Confirmation of Reversal: The Dragonfly Doji serves as a psychological signal that the worst of the downtrend may be over. If confirmed by subsequent bullish price action, it reinforces the belief that a reversal is underway, leading to further buying and a potential uptrend.


How to trade Dragonfly Dogi Pattern
Aggressive Entry Point:
Entry: Enter a long position immediately after the Dragonfly Doji candle closes.
Stop-Loss: Place a stop-loss order below the low of the Dragonfly Doji candle to manage risk.
Target: Set an initial target based on the nearest resistance level or previous high, using a risk-reward ratio of at least 1:2.
Conservative Entry Point:
Entry: Wait for a confirmation candle (a bullish candle closing higher than the Dragonfly Doji) before entering a long position.
Stop-Loss: Place a stop-loss order below the low of the Dragonfly Doji candle.
Target: Set an initial target based on the nearest resistance level or previous high, adjusting as the price moves in your favor with trailing stops.

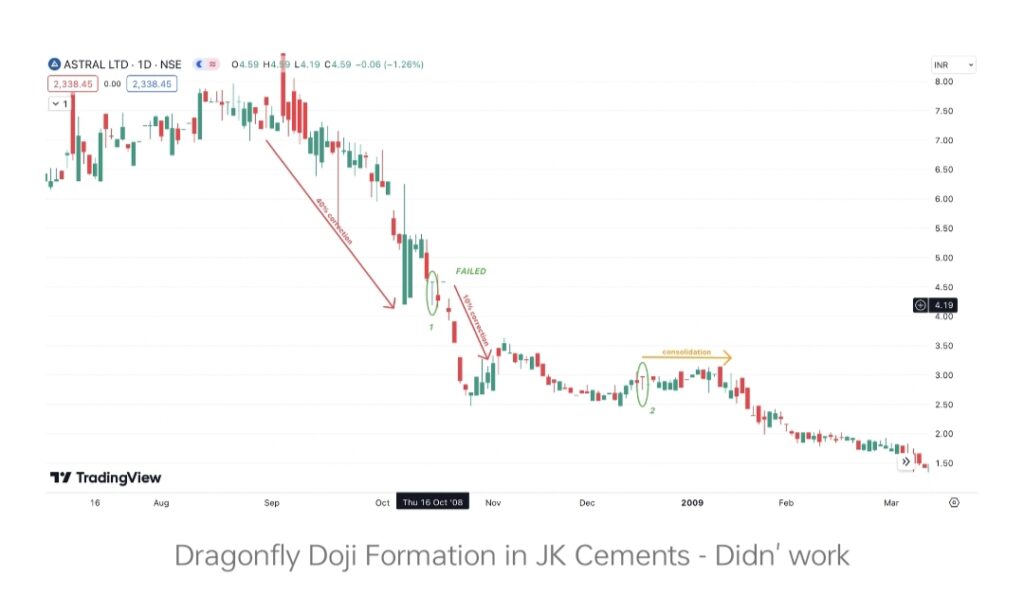
example of some times it does not work…
Hammer Candlestick Pattern: Meaning, Strategies, and Real Examples
The candlestick patterns detected in this article are for educational purposes only. They do not guarantee future price movements or trading success. Always conduct your research and analysis before making any trading decisions. Trading involves risk, and past performance is not indicative of future results. The content and tools provided in this article, including strategies, are based on our experience and interpretation of market trends. These are intended for educational purposes only and should not be considered as financial advice or recommendations for trading. Trading and investing involve substantial risk, and past performance does not guarantee future results. We strongly advise consulting with a certified financial advisor or professional before making any trading decisions.