

In This Article’s
Candlesticks In Technical Analysis
Candlesticks are like a window into the market’s emotions, helping you understand who’s winning the battle between buyers and sellers.
What are Candlesticks?
Candlesticks visually display the market’s price action within a given time frame, showing where the price opened, closed, and how far it moved during that period.
Why use Candlesticks?
They provide a clear snapshot of market sentiment, allowing traders to quickly assess whether buyers or sellers are in control and how that might affect future prices.
Practical Considerations
Start by observing candlestick charts on historical data. This practice will help you see how market movements are captured by candlesticks, which will be crucial for making decisions in live trading.
What are the candlesticks?

A candlestick is a tool used in financial charts to represent the price movements (open, high, low, and close) of an asset, such as a stock, over a specific period of time. Each candlestick provides a visual summary of an asset’s price action, making it easier to identify trends and patterns that can aid in making trading decisions.
Structure of a Candlestick
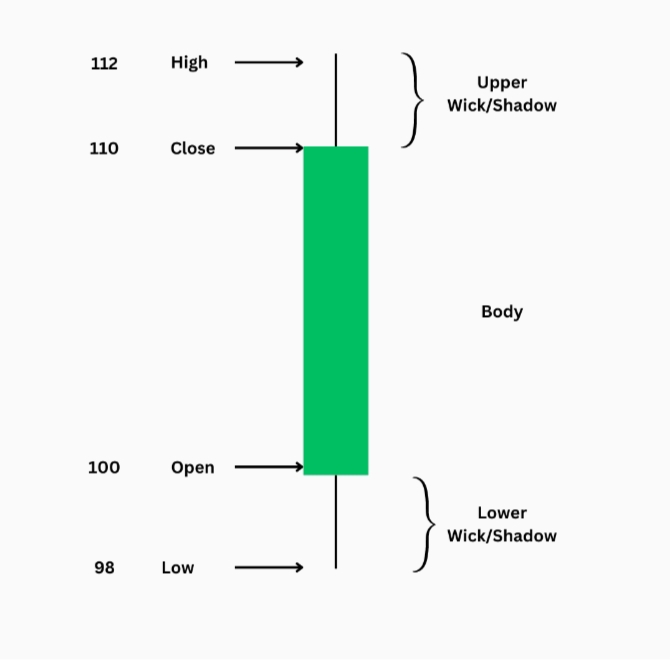
A candlestick is made up of three main components that provide key insights into market sentiment and price action:
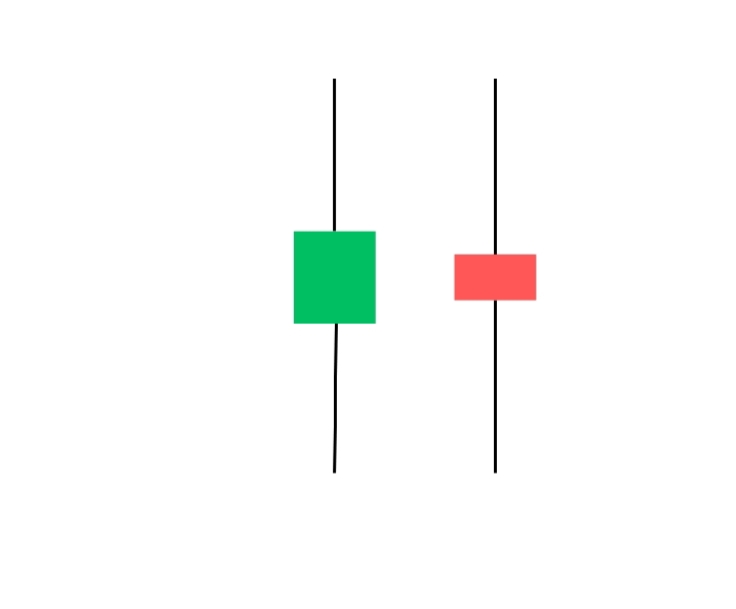
Body: This represents the range between the opening and closing prices.
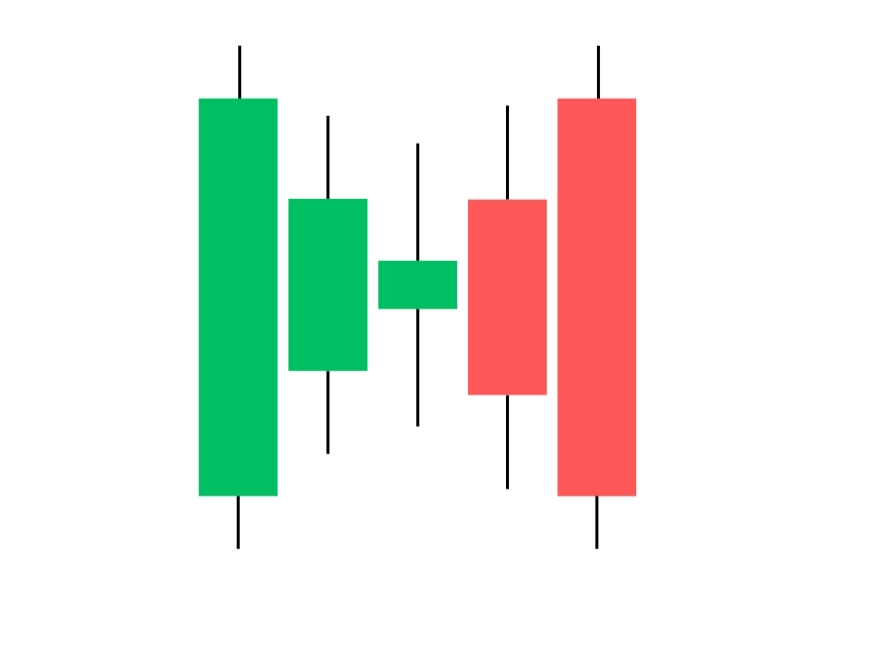
Bullish Candlestick (Green/White) occurs when the closing price is higher than the opening price. Typically, these candlesticks are coloured green or white, signalling buying pressure.
Bearish Candlestick (Red/Black) occurs when the closing price is lower than the opening price, indicating selling pressure. These are usually coloured red or black.
Wicks (or Shadows): These thin lines extend above and below the body.
The Upper Wick shows the highest price reached during the period, while the Lower Wick reveals the lowest price.
Open and Close Prices: The Opening Price is where the asset began trading during the specified period, and the Closing Price represents the final price at the end of that period.
Understanding these components helps traders make sense of price action in the market. The interaction between the body and wicks tells a story of buyer and seller momentum, allowing for the identification of trends and potential reversals.
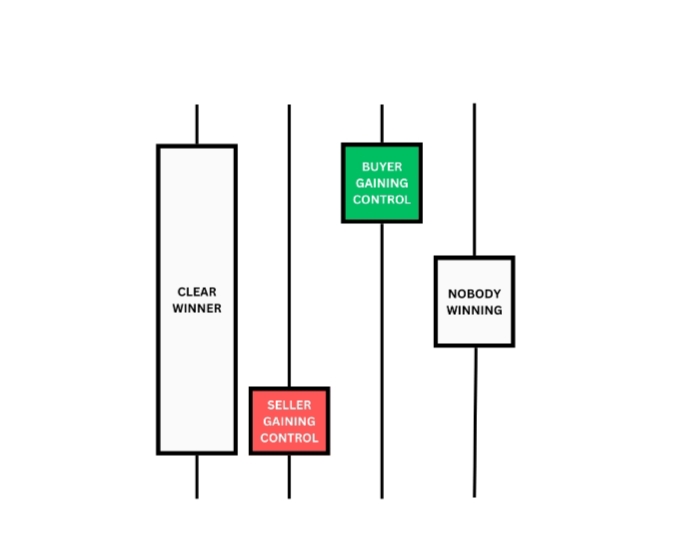
Body Size And Market Strength

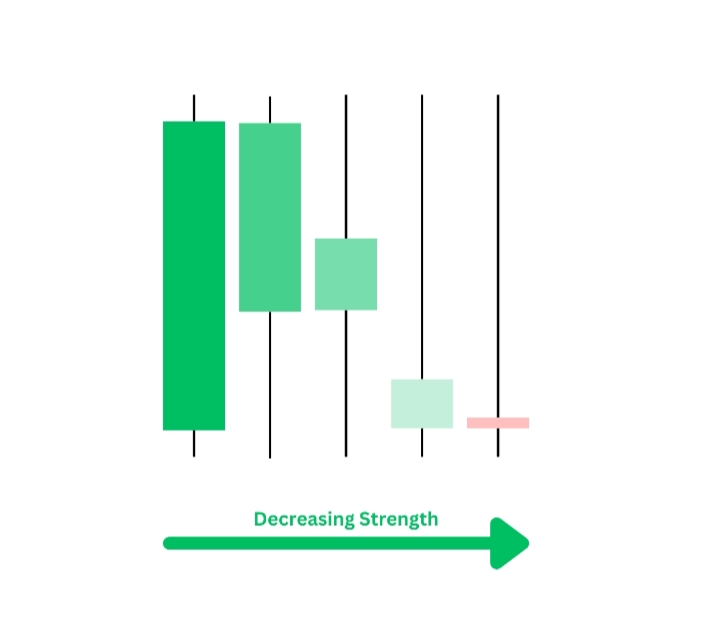
The size of the candlestick’s body gives you a direct insight into the strength of the market’s movement during a trading session. It can help show who was in control and how confident they were.
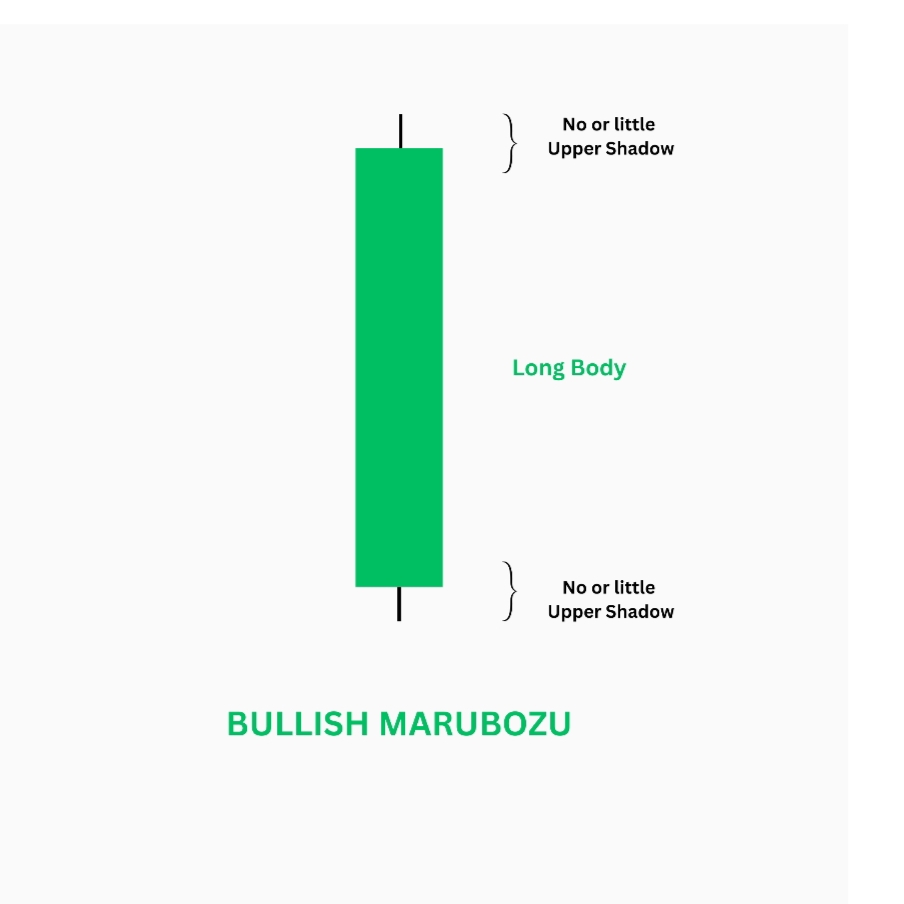
Large Body
A large body indicates strong momentum, with either buyers (if green) or sellers (if red) dominating the session.
Small Body
A small body suggests that the market was indecisive, with little movement between the opening and closing prices.
Tips
Use the size of the body to gauge the strength of a trend. For example:
1). In a strong uptrend, look for large green bodies as confirmation of the bull’s strength.
2). In a strong downtrend, look for large red bodies as confirmation of the bear’s strength.
Wicks And Volatility Insight


The wicks of a candlestick provide valuable clues about market volatility and potential price rejection at certain levels. Different types of wicks might indicate varying levels of market sentiment.
Long Upper Wick
Indicates that while buyers pushed the price higher, sellers stepped in and drove it back down, suggesting resistance at higher levels.
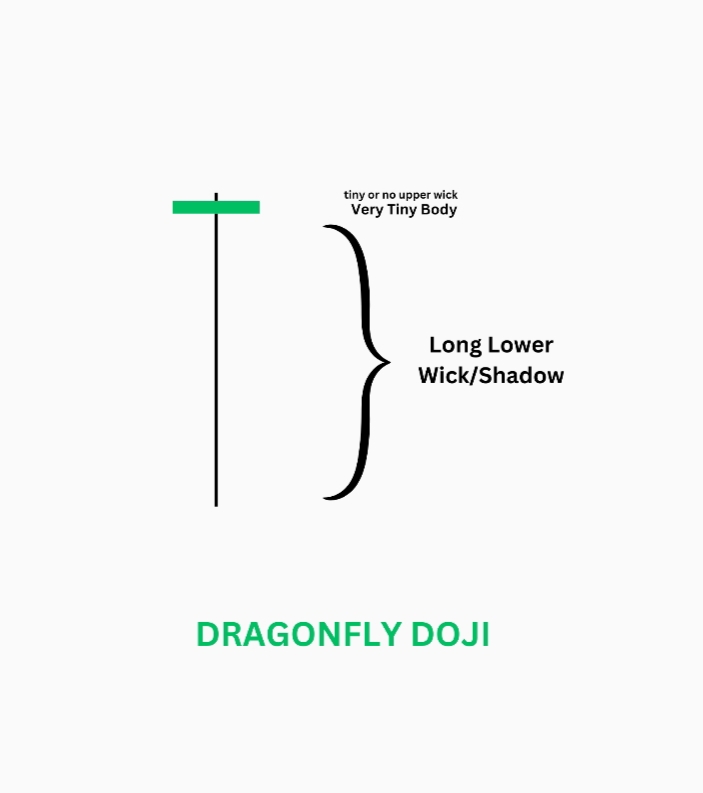
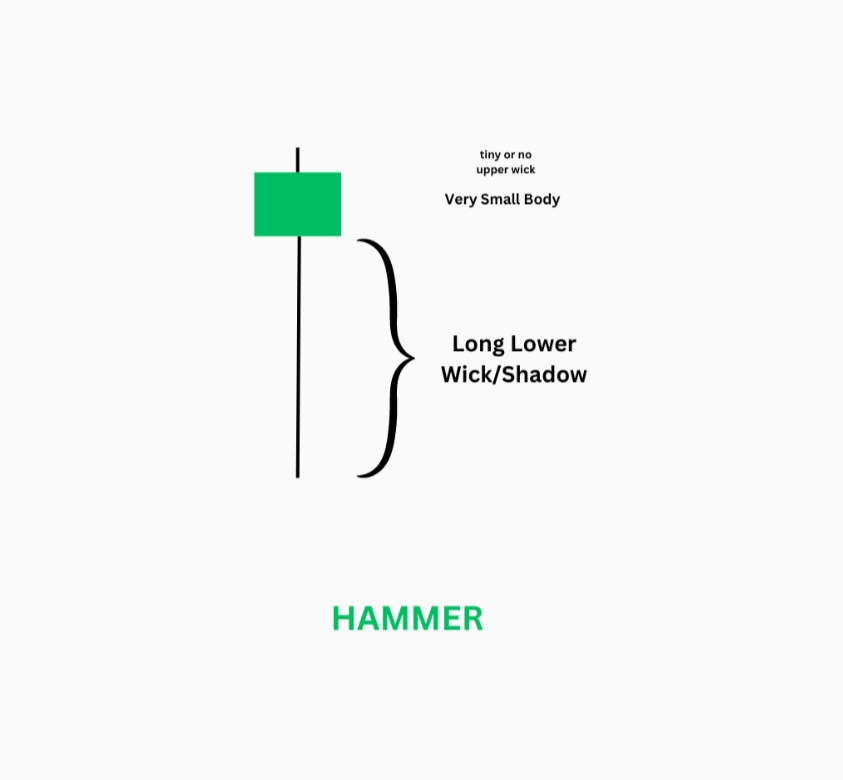
Long Lower Wick
It suggests that sellers drove the price down, but buyers pushed it back up, indicating support at lower levels.
Short Wicks
Indicate a session where prices stayed close to the opening and closing levels with less volatility.
Candlestick Range And Momentum

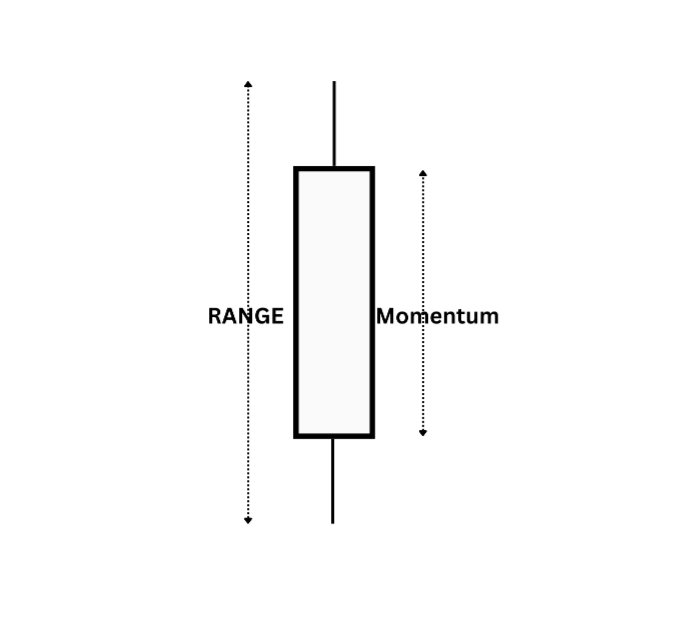
The range of a candlestick, from its highest to its lowest point, is a direct indicator of market momentum.
Range
The range represents the full extent of price movement during the session. A wide range suggests strong momentum, while a narrow range indicates weaker momentum.
Momentum
Candlesticks with a wide range and a large body show strong directional movement, often signalling the continuation of a trend. A narrow range may suggest consolidation.
Monitor candlestick ranges during trends. The range of a candlestick gives you insight into how vigorously the market moved during the session, helping you gauge the strength of ongoing trends.
1). A sudden increase in the range can indicate a breakout.
2). While a decrease may suggest that the trend is losing steam.
Indecision Candles

An indecision candle is a type of candlestick that indicates uncertainty or a lack of clear direction in the market.
Characteristics of Indecision Candles
It forms when neither buyers nor sellers can gain full control, resulting in a small difference between the opening and closing prices. This candle typically has a small body with relatively long wicks on both ends, showing that the price moved up and down during the period but ultimately closed near where it opened.
Doji
The open and close prices are almost the same, creating a very small or nonexistent body. The wicks can be of varying lengths, reflecting the price movement in both directions during the session.
Spinning Top
This candle has a small body with longer upper and lower wicks, indicating that the market moved in both directions before closing near the opening price.
Indecision candles suggest that the market is at a crossroads, with buyers and sellers equally matched. When you see an indecision candle, it’s important to consider the broader market context. Traders often look for confirmation from subsequent candles to determine whether the market will break out in a new direction or continue in its current trend.
Reachout Us….


Winston here from Iowa. I’m always watching to see what newer sites are going up and I just wanted to see if you would like an extra hand with getting some targeted traffic, Create custom AI bots to answer questions from visitors on your site or walk them through a sales process/funnel – I could even make a persona of yourself or employee to field questions about your business. I create/edit videos/images/adcopy, create/revamp/update sites, remove negative listings, the list goes on. I’ll even shoulder 90% of the costs, dedicating my time and tools that I’ve created myself and bought over the years. I’ve been doing this for over 22 years, helped thousands of people and have loved every minute of it.
There’s virtually no cost on my end to do any of this for you except for my time starting at 99 a month. I don’t mean to impose; I was just curious if I could lend a hand.
Brief history, I’ve been working from home for a couple decades now and I love helping others. I’m married, have three girls and if I can provide for them by helping you and giving back by using the tools and knowledge I’ve built and learned over the years, I can’t think of a better win-win.
It amazes me that no one else is helping others quite like I do and I’d love to show you how I can help out. So, if you need any extra help in any way, please let me know either way as I value your time and don’t want to pester you.
PS – If I didn’t mention something you might need help with just ask, I only mentioned a handful of things to keep this brief 🙂
All the best,
Winston
Cell – 1-319-435-1790
My Site (w/Live Chat) – https://cutt.ly/bec4xzTQ
thank you so much for yours kind words. we will definitely work on your suggestion….