In this article
Market Psychology In Candlestick Patterns
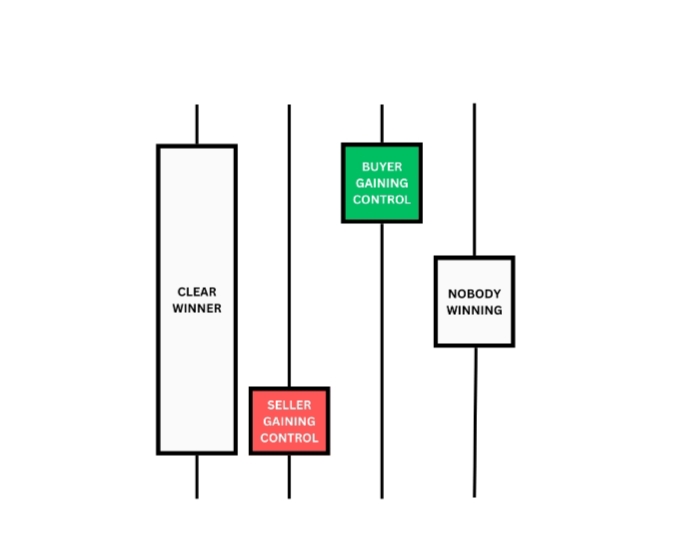
Candlestick patterns reflect the emotions and actions of market participants, helping you understand the psychology driving price movements. Candlesticks are more than just price indicators; they are visual representations of market sentiment and the psychological battles between buyers and sellers.
Bullish Candles
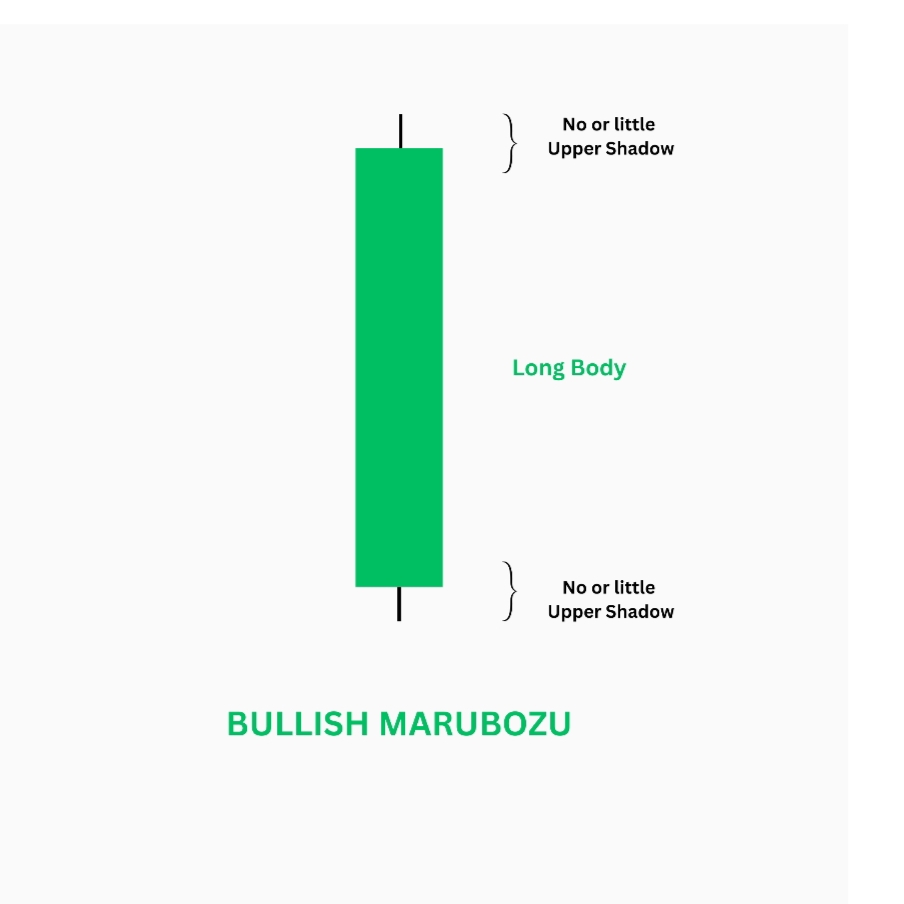
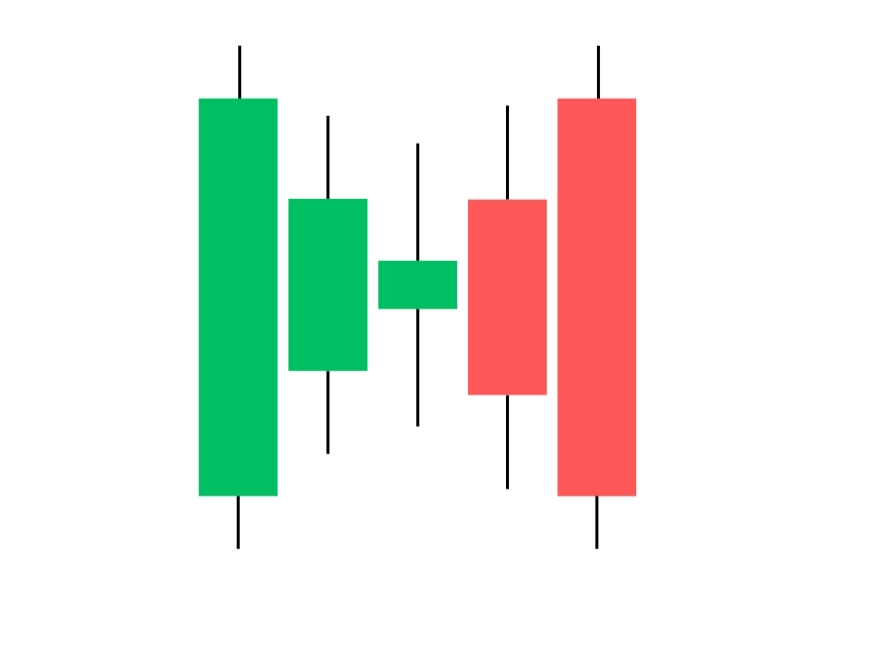
Large green bodies suggest strong buying pressure, indicating confidence among buyers and the potential for higher prices.
Bearish Candles
Large red bodies show that sellers were in control, driving prices down and signalling possible further declines.
Rejections (Wicks)
Long wicks indicate price rejection, where one side of the market tried to push prices but was ultimately overpowered.
Tips
1). Use candlestick formations to gauge the mood of the market. For example, a bullish candle with a long upper wick might indicate buyer exhaustion, hinting at a potential reversal.
2). Significant wicks on both sides may indicate consolidation in the market, as bulls and bears are still fighting with equal strength.
Analyzing Candlestick’s Patterns

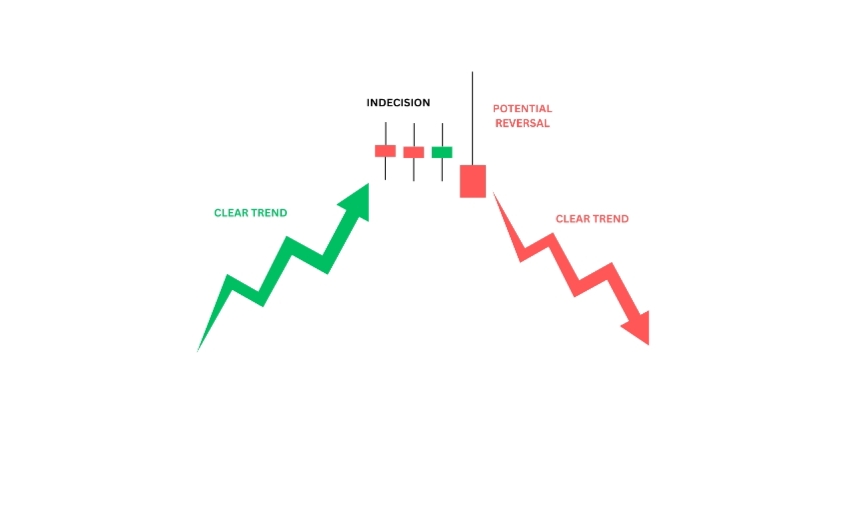
Candlesticks are most effective when analysed within the broader context of the market, including trends, support, and resistance levels.
Trend Analysis
Candlesticks provide stronger signals when viewed within the context of the overall trend. For example, a bullish candlestick in an uptrend may confirm the continuation of that trend.
Support and Resistance
Pay special attention to candlesticks that form around key support and resistance levels, as they can provide clues about potential breakouts or reversals.
Volume Consideration
Volume adds another layer of context to candlestick analysis. A large candlestick on high volume is often more significant than one on low volume.
Tips
Always combine candlestick analysis with other tools like moving averages or trend lines. This helps to confirm signals and reduce the risk of false readings.
What Are The Candlestick Patterns?
Candlestick patterns are specific formations created by one or more candlesticks on a price chart. These patterns can help traders predict future price movements based on historical price data. By recognizing these patterns, traders can make more informed decisions about when to buy or sell stocks.
Although these patterns alone wouldn’t be enough to create a trading setup for you, you need to look for confluence with other signals, e.g. support, resistance, trend lines, etc.
The Candlestick patterns by themselves could be very good “entry points” for the trading system you will create based on your strategy, goal, etc.
We can categorise most of the candlestick patterns into 3 major types based on the number of candlesticks needed to confirm the pattern.
1). one candlestick pattern’s

These candlestick patterns are made using only one candle.
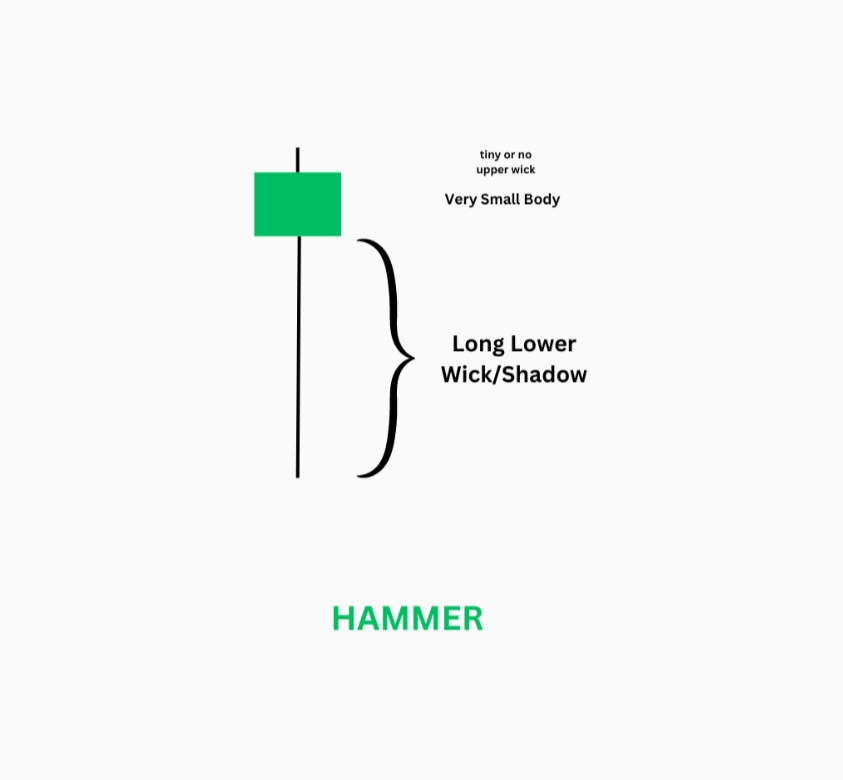
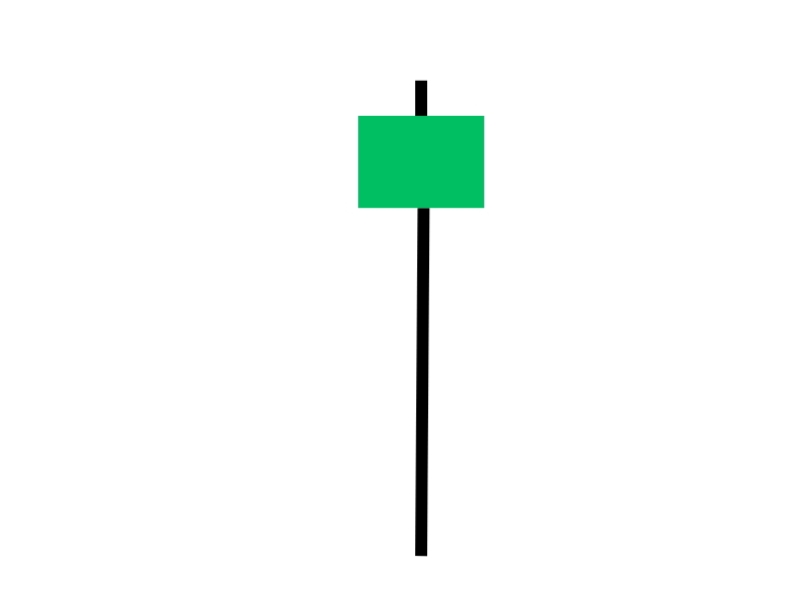
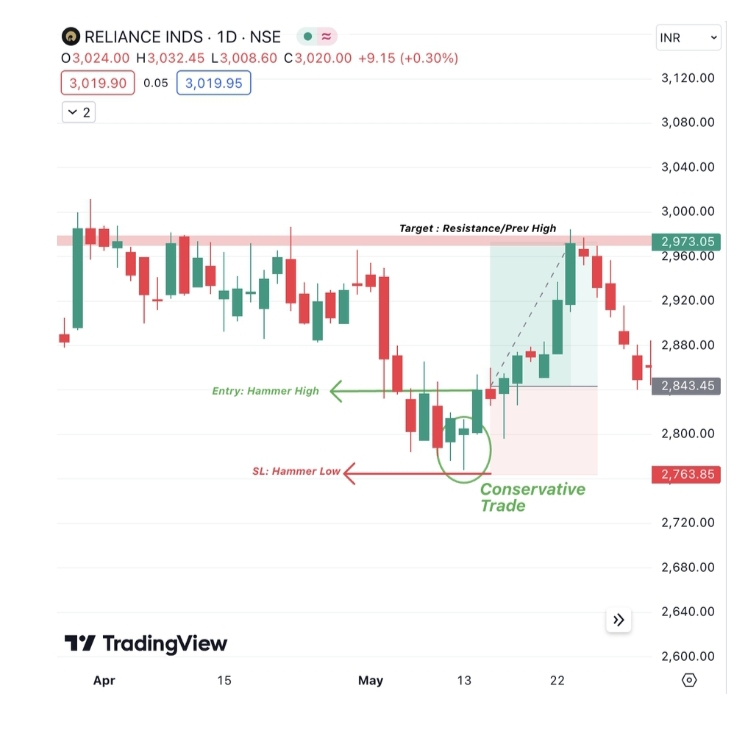
Hammer:
What it looks like: A small body with a long lower wick.
What it means: Often appears at the bottom of a downtrend, indicating a potential reversal to an uptrend.
Shooting Star:
What it looks like: A small body with a long upper wick.
What it means: Often appears at the top of an uptrend, indicating a potential reversal to a downtrend.
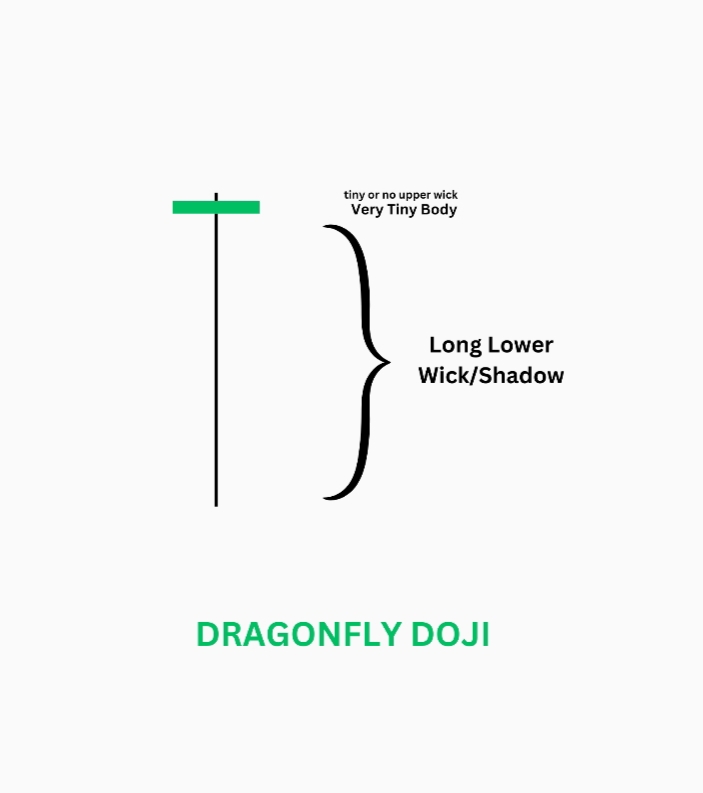
Doji:
What it looks like: The opening and closing prices are almost the same, creating a very small body with long wicks.
What it means: Indicates indecision in the market; can signal a potential reversal or continuation of the trend, depending on context.
2). Two candlestick patterns

These candlestick patterns are made using two candles.
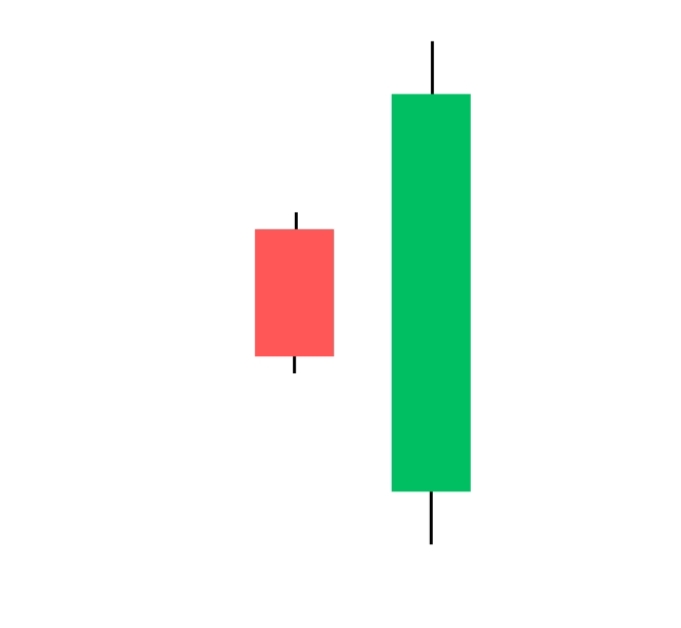
Bullish Engulfing:
What it looks like: A small bearish (red) candlestick followed by a larger bullish (green) candlestick that completely engulfs the previous candle’s body.
What it means: Indicates a potential reversal from a downtrend to an uptrend.
Bearish Engulfing:
What it looks like: A small bullish (green) candlestick followed by a larger bearish (red) candlestick that completely engulfs the previous candle’s body.
What it means: Indicates a potential reversal from an uptrend to a downtrend.
3). Three candlestick patterns

These candlestick patterns are made using three candles.
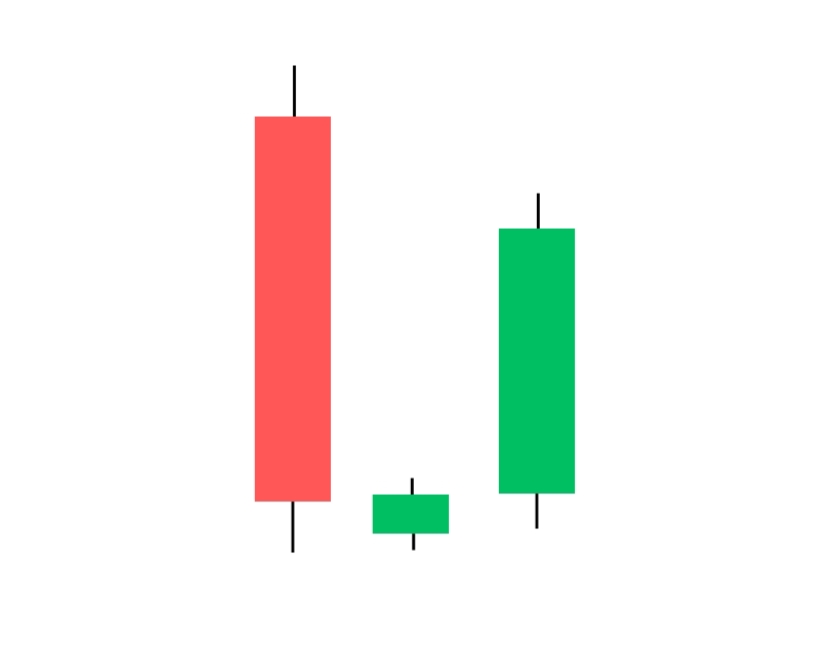
Morning Star:
What it looks like: A long bearish (red) candlestick, followed by a small-bodied candlestick (either red or green), and then a long bullish (green) candlestick.
What it means: Often appears at the bottom of a downtrend, signalling a potential reversal to an uptrend.
Evening Star:
What it looks like: A long bullish (green) candlestick, followed by a small-bodied candlestick (either red or green), and then a long bearish (red) candlestick.
What it means: Often appears at the top of an uptrend, signalling a potential reversal to a downtrend.
How To Use Candlestick Patterns

Identify the Pattern: Look at the price chart to spot recognisable candlestick patterns.
Confirm the Pattern: Use additional indicators or wait for the next candlestick to confirm the pattern’s signal.
Make a Decision: Based on the pattern and its context within the broader market trend, decide whether to buy, sell, or hold the stock.
The candlestick patterns detected in this article are for educational purposes only. They do not guarantee future price movements or trading success. Always conduct your research and analysis before making any trading decisions. Trading involves risk, and past performance is not indicative of future results.
Reach out Us…